
Interactive in-editor computational performance profiling, visualization, and debugging for PyTorch deep neural networks.
🏖 In-editor Profiling
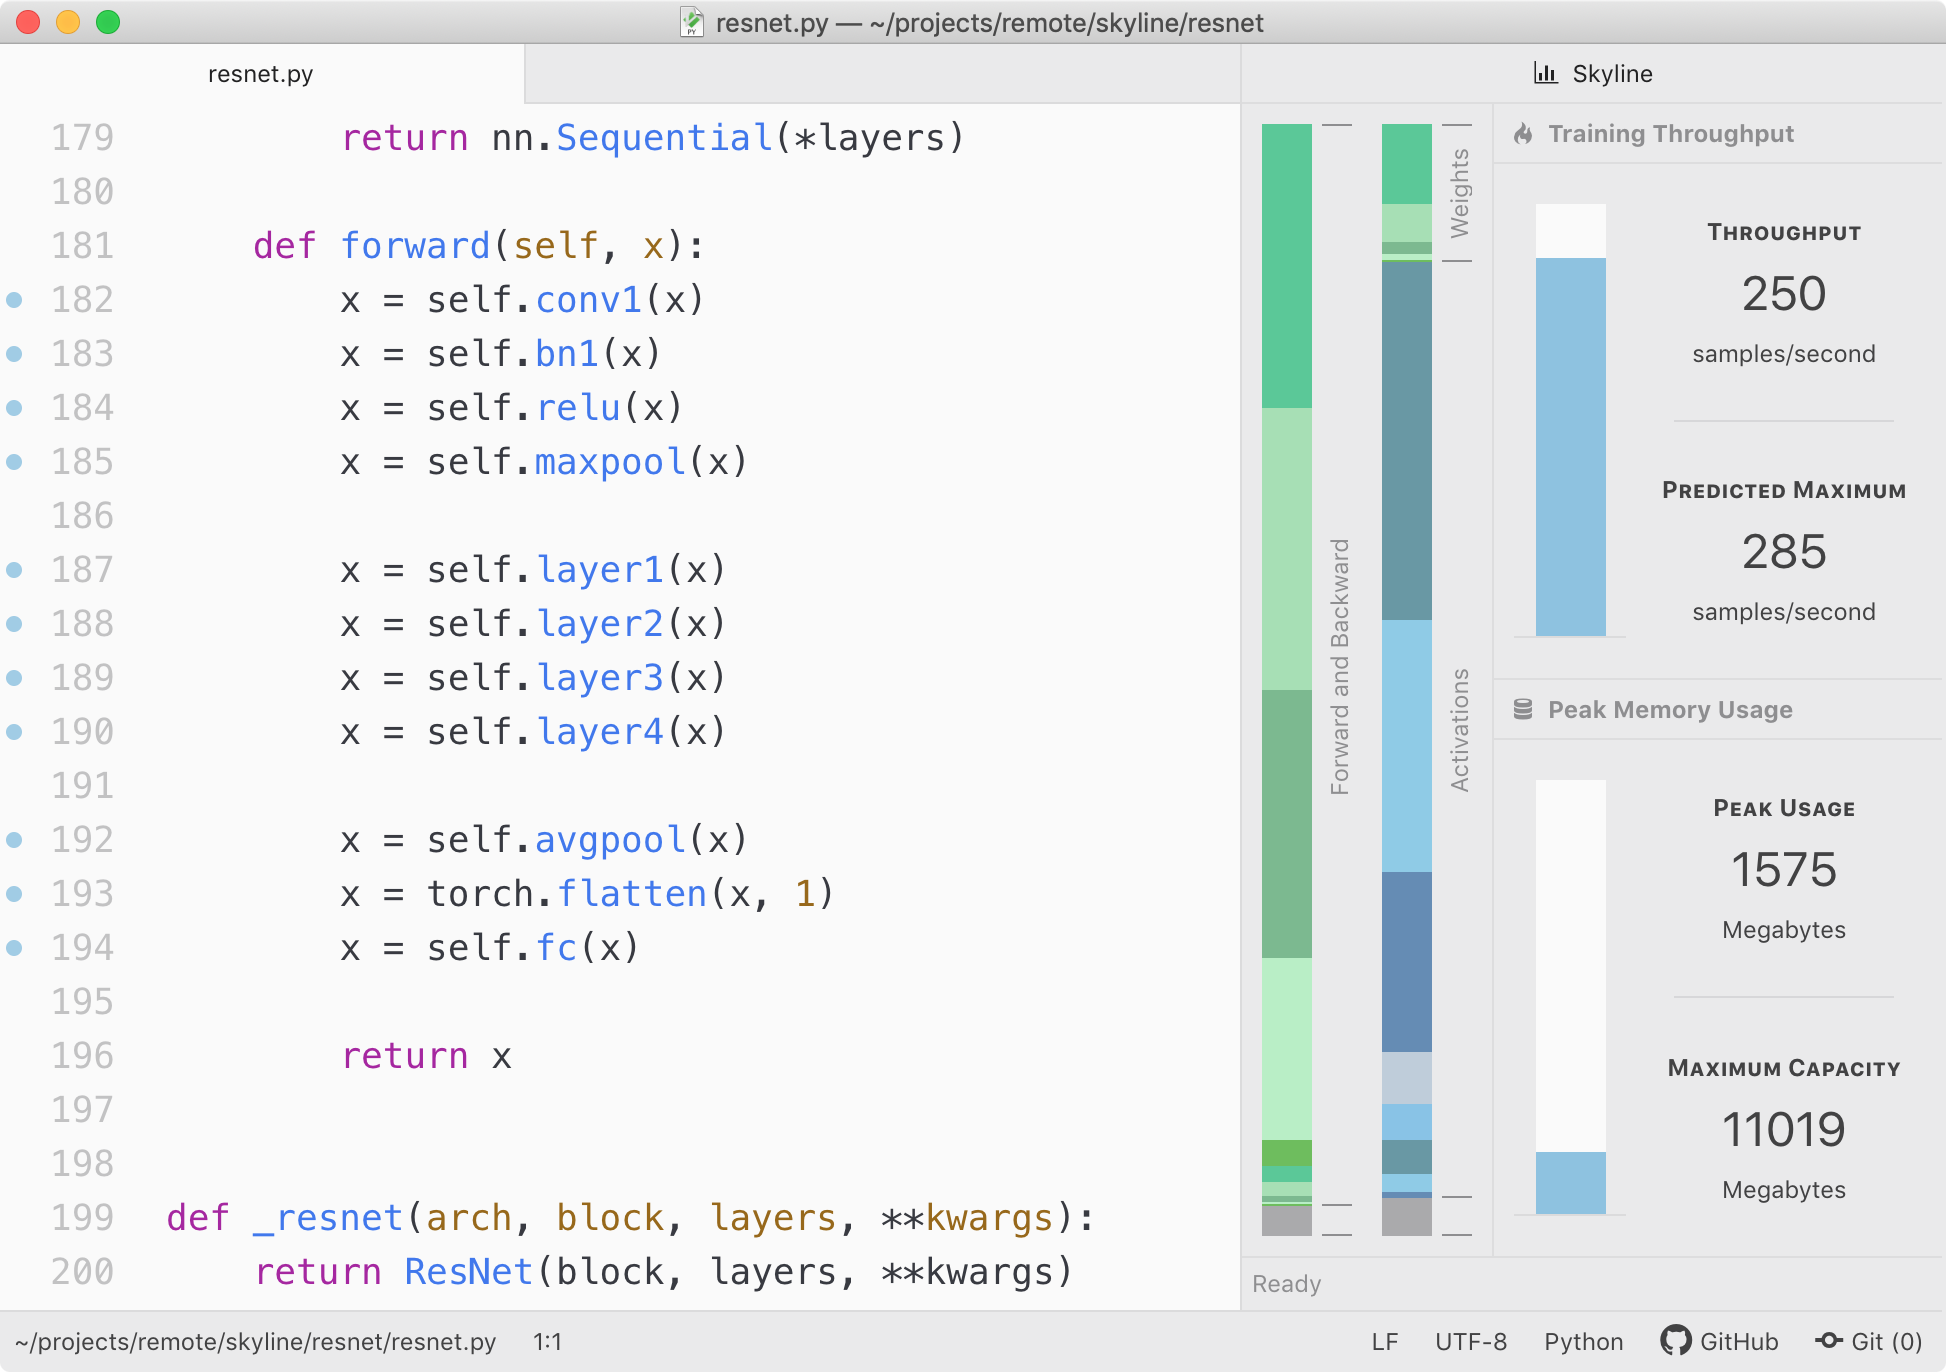
Profile your models from the comfort of your text editor! Skyline works as a plugin for Atom. It displays overviews and breakdowns of key performance metrics such as training throughput and memory usage.
🔮 Interactive Visualizations
Skyline's performance visualizations are interactive! Hovering over a visualization will reveal its associated line(s) of code. When dragging certain visualizations, Skyline can also make predictions about the throughput and memory usage of different batch sizes.
🎈 Profile While You Develop
No more performance surprises! Skyline transparently profiles your model in the background as you make changes during development. You'll be the first to know when changes to your model affect its computational performance.