Introduction
What is Skyline?
Skyline is a tool used with Atom to profile, visualize, and debug the computational training performance of PyTorch deep neural networks.
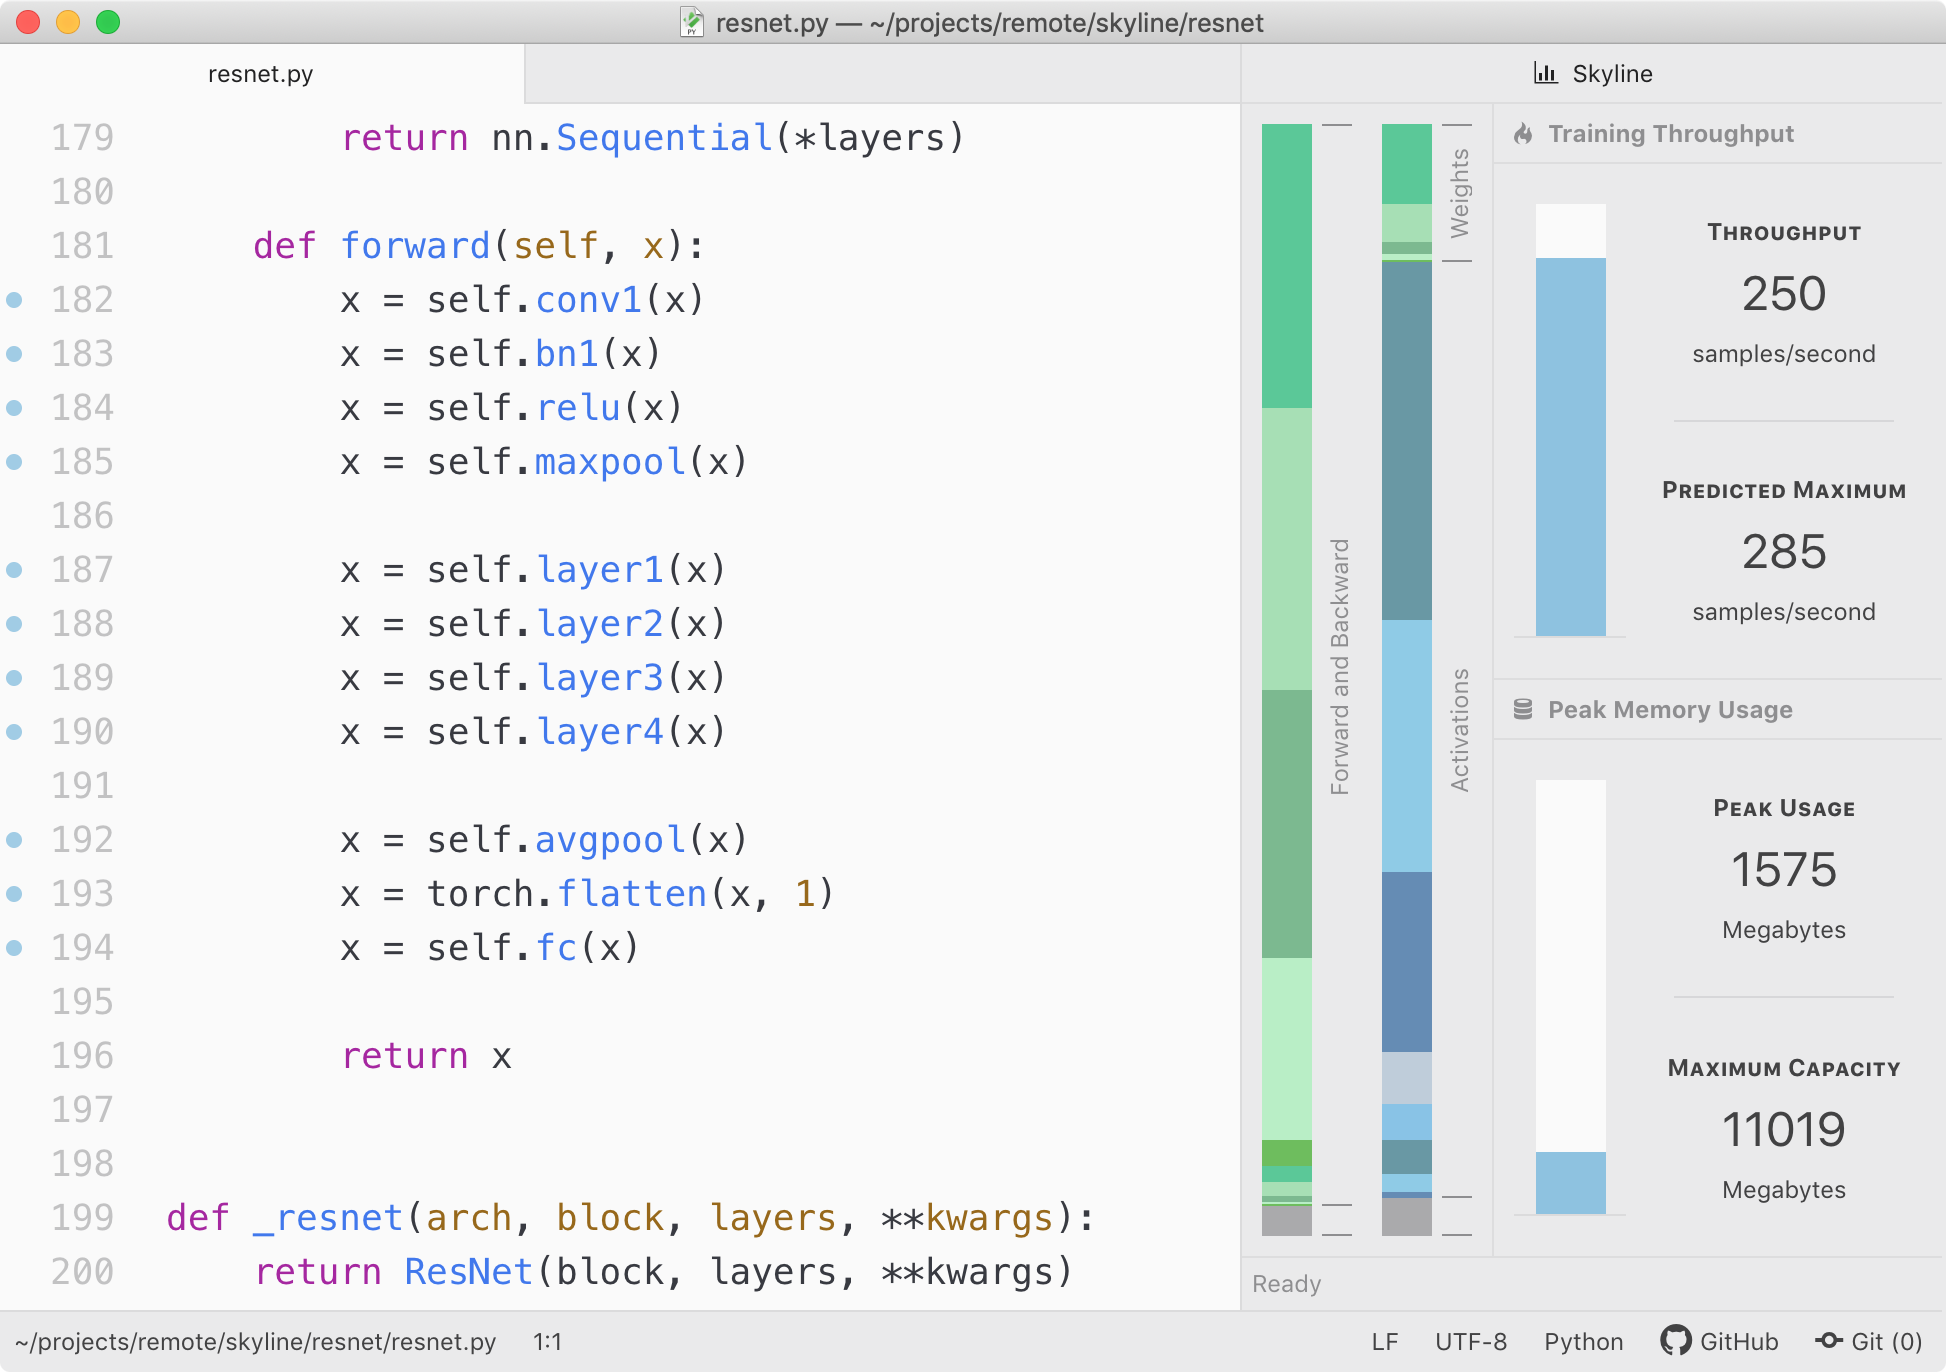
What makes Skyline special is that it provides interactive performance profiling. When hovering over visualizations, Skyline will highlight the line(s) of code associated with that visualization—making it easy to connect the profiling data to the code. Some of Skyline's visualizations are also manipulatable. When dragging the throughput or memory visualizations, Skyline will mutate the code to indicate the batch size that should be used to achieve these manipulated metrics.
As an in-editor profiling tool, Skyline can help you recognize and diagnose performance issues during development. Skyline transparently re-profiles your model in the background as you make changes to ensure that you always get to see the latest performance data.
Skyline is also a standalone performance profiler. If you do not want to use the interactive profiling interface, you can also get Skyline to output a file with its profiling data. See the Standalone Profiling page for more information.
Why Build Skyline?
Deep neural networks (DNNs) have taken the world by storm. However, using DNNs in practice can be challenging because they can take a significant amount of computational resources and time to train.1,2,3 As a result, there are often times when developers will need to debug and tune their DNNs for performance. The problem is, doing this debugging and tuning effectively with existing tools is difficult! It requires intimate knowledge across the entire software and hardware stack—something that not all deep learning developers have (or should need).
With Skyline, our goal was to build an easy-to-use tool that is tailored for deep learning developers. Skyline lets you inspect the computational training performance of your models directly in your development environment. It shows domain-specific metrics such as your model's training throughput and memory footprint. And it supports a variety of additional features such as
- 🏖 In-editor computational performance profiling
- 🔮 Interactive code-linked visualizations
- 🎈 Profiling during development
- 💾 Memory profiling: overall usage and breakdowns
- 🛰 Remote project profiling support (alpha)
We designed Skyline to be intuitive and fun to use. We hope that you will give it a try!